From data to insights: the power of agricultural infographics
Data plays a pivotal role in the world of Agribusiness. All fields of Agronomy are dealt with a constant stream of information, covering everything from crop yields and weather conditions to market shifts and supply chain operations. Knowing how to convey the data efficiently to stakeholders’ partners and their clients poses a challenge often met with lengthy presentations or documents where the key message can be lost.
This is where infographics step in.
Communication: A necessity in Agribusiness
Our brains are wired to process visuals faster and more effectively than plain text. In a data intensive field like Agribusiness, it’s crucial to communicate complex information in a straightforward manner. This is where infographics truly excel. They are visual representations of data, information, or knowledge that are designed to present information quickly and clearly, often using a combination of text, charts, graphs, icons, and images.
Data can be displayed in a variety of different ways, each suitable for different types of data:

Case Study: Seasol
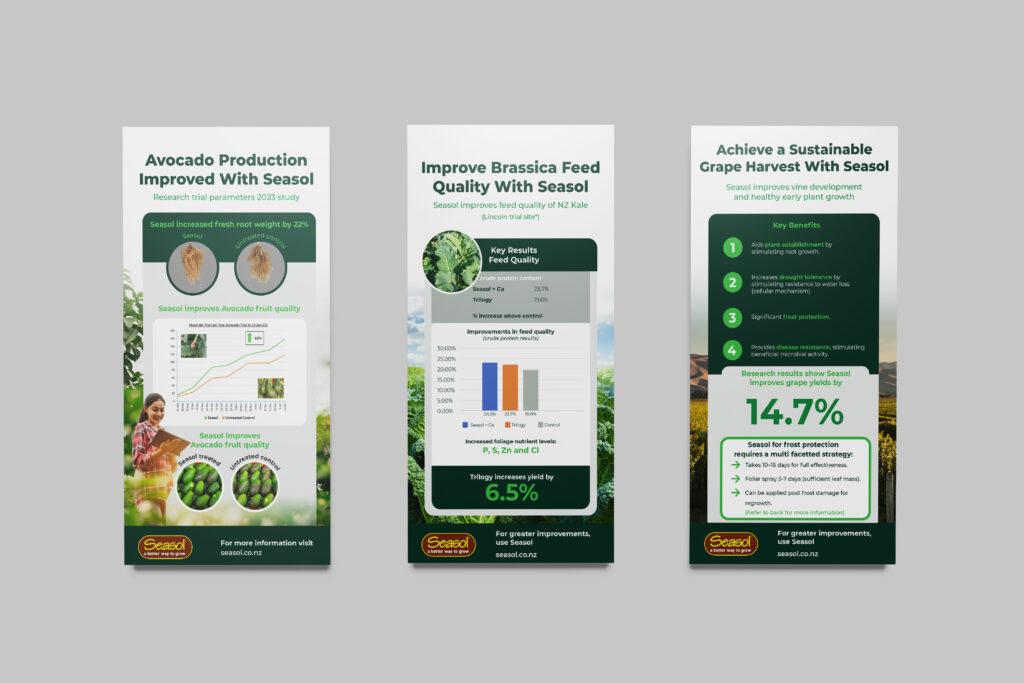
To see the power of agricultural infographics in action, let’s take a look at one of our long-time clients, Seasol.
Seasol approached us with a task. They wanted to present three sets of trial data, namely Brassica, Viticulture, and Pasture, to hand out to potential clients during upcoming conferences they were scheduled to attend.
We transformed their intricate trial data into an engaging infographic by using a mixture of easy-to-follow graphs, captivating imagery and concise labels, making the data accessible to a wide audience.
After creating the infographic, our next step was to format it into a DLE size, which is a convenient choice for handing out physical copies during conferences. Additionally, we ensured that Seasol had access to the digital files, allowing them the flexibility to seamlessly share the infographic across their various social media channels. This way, they could effectively reach both in-person and online audiences, maximizing the impact of their data presentation.
The result? Potential clients not only had easy access to the data but also found it remarkably straightforward to comprehend. This enhanced accessibility and clarity empowered them to swiftly grasp the information they needed, enabling them to make well-informed decisions with confidence.
Conclusion
In today’s fast-moving business world, one thing is clear; getting your message across effectively matters in any industry. We have underlined the value of using simple tools like infographics to break down complex data, whether you’re reaching out in person or online. By adapting your information into a handy DLE format for paper distribution and sharing digital versions online, you can bring together the old and new ways of communicating.
This approach, in Agribusiness or any other field, ensures that everyone—your partners, stakeholders, and potential clients—can quickly understand important information. It’s a reminder that in this age of information, combining a straightforward approach with professionalism is the key to making sure people get the message and can make informed choices.
Are you ready to transform your agricultural data into compelling visuals?
Author: Christie-Leigh Miller – Creative Director